Membership Demographics Report
This report is a benchmark to measure changes in AIA’s member demographics. It includes member-reported data for all AIA membership categories plus demographics for the AIA Board of Directors, AIA Strategic Council, and AIA headquarters staff.
New! 2025 Demographics report
The AIA Membership Demographics Report is an annual benchmark for understanding change across the architectural profession.
Using voluntary, member‑reported data, the 2025 report highlights key demographic trends across race and ethnicity, gender identity, age, sexual orientation, licensure progress, and leadership participation—providing a comprehensive view of AIA’s membership today.
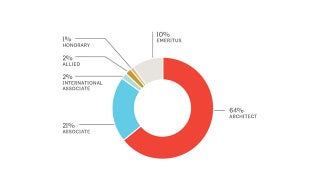
Overall membership by member type
A record 101,057 members across 120+ countries, with a 90% retention rate.
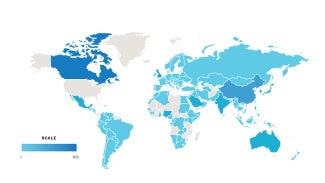
AIA members living outside the U.S.
While fewer than 5% of members live outside the U.S., international members are represented across every membership category, including about 50% of International Associates.
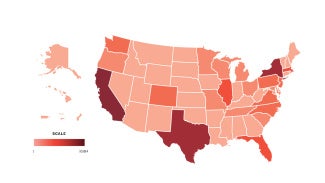
AIA domestic membership by state
64% of AIA members are U.S.-licensed architects.
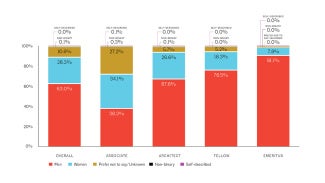
Gender identity and expression across groups
Women represent 26.3% of all members. Among Associates, 34.1% are women, compared to 26.6% of Architect members.
Race and ethnicity across groups
17.9% of all members identify as part of underrepresented racial and ethnic groups, with Asian and Hispanic/Latino members being the largest represented groups.
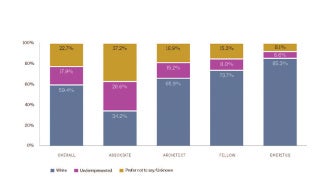
Associate and Architect members by race and ethnicity
Nearly one-third of Associates identify as underrepresented, compared to 15.2% of Architects. Men continue to outnumber women across most racial and ethnic groups.
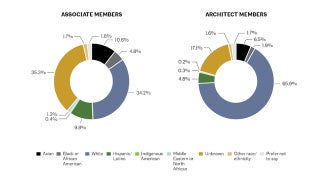
35.3% White, 10.6% Asian, 9.8% Hispanic or Latino, 4.8% Black or African American, 1.8% Middle Eastern or North African, 0.4% Indigenous American, 1.7% other race or ethnicity, 1.3% prefer not to say, and 34.2% unknown. Percentages total 100%.
Architect members’ race and ethnicity are distributed as follows:
65.9% White, 6.5% Asian, 4.8% Hispanic or Latino, 1.9% Black or African American, 1.7% Middle Eastern or North African, 0.3% Indigenous American, 1.6% other race or ethnicity, 17.1% unknown, and 0.2% prefer not to say. Percentages total 100%.
Architect members who obtained licensure in 2025 by race and ethnicity
879 Architect members reported initial licensure and transitioned from Associate to Architect—up 6% from the previous year.
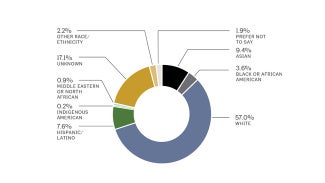
57.0% White, 9.4% Asian, 7.6% Hispanic or Latino, 3.6% Black or African American, 0.9% Middle Eastern or North African, 0.2% Indigenous American, 2.2% other race or ethnicity, 1.9% prefer not to say, and 17.1% unknown. Percentages total 100%.
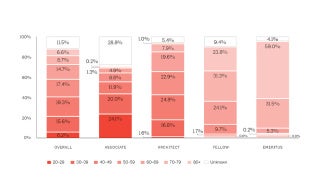
Age distribution across groups
20–29-year-olds make up the largest share of Associates, while ages 40–49 are the largest group among Architects.
About the report
The report provides a snapshot of AIA’s evolving membership and serves as a strategic tool to help chapters, firms, and members focus efforts where they can drive the greatest impact.
For broader insight into education, licensure, and the professional pipeline, readers are encouraged to consult the National Architectural Accrediting Board (NAAB) on accredited education programs and the National Council of Architectural Registration Boards (NCARB) By the Numbers report.
Past reports
The 2024 Membership Demographics Report
The 2023 Membership Demographics Report
The 2022 Membership Demographics Report
The 2021 Membership Demographics Report

It’s never too early to start thinking like an architect. AIA's K-12 initiatives follow a blueprint with three key goals in mind:
Inspire youth to learn about the power of design.
Nourish curiosity to