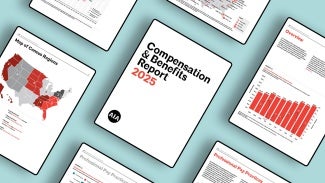
AIA Compensation & Benefits Report
The architecture profession’s most trusted source for salary, benefits, and workplace practices—built on data from hundreds of firms across the U.S.
Authoritative data for every compensation decision
Compensation is one of the most critical—and most sensitive—topics in architecture. That’s why AIA collects and analyzes data from hundreds of architecture firms to produce the industry’s most comprehensive, trusted, and current report on salary and benefits. The 2025 edition delivers a clear picture of how firms structure salaries, benefits, professional development, and workplace practices.
For firms, it’s an indispensable resource for recruitment, retention, and equity. For individuals, it offers the insights you need to make informed career decisions and evaluate opportunities with confidence.
Bring trusted data to the conversations that matter most with the AIA Compensation & Benefits Report 2025.
Behind the AIA Compensation & Benefits Report 2025 is one of the most extensive data collections on salary and benefits in architecture. With thousands of positions reported across hundreds of firms, this resource offers detailed breakdowns that firms and individuals can trust for hiring, retention, and career planning. The new Compensation & Benefits Benchmark Tool lets you go deeper—comparing your firm’s salaries and benefits by region, size, and role.
Essential for firms, professionals, & recruiters
With data spanning 34 states, 45 metro areas, and thousands of positions, the AIA Compensation Report 2025 is the go-to resource for understanding compensation in the architecture market.
Bring trusted data to the conversations that matter most.
Benchmark compensation across roles, firm sizes, and regions to attract and retain top talent.
- See detailed pay ranges for 45 unique architecture positions
- Compare salaries by firm size, region, and experience level
- Ensure your offers align with industry standards
Evaluate pay and benefits packages against market data—and identify where adjustments can boost recruitment and retention.
- Design packages that support loyalty and reduce turnover
- Understand which roles saw the strongest salary growth
- Track benefits trends, from licensure support to remote work
Understand compensation trends across positions, experience levels, and geographies to make confident moves in your career.
- Identify cities, regions, and roles offering the highest pay
- See how compensation shifts as architecture professionals gain experience
- Use data to inform negotiations and evaluate opportunities
Bring objective, comprehensive data to sensitive discussions around pay equity and workplace practices.
- Compare compensation by role, geography, and firm type
- Spot disparities in pay and professional development support
- Use evidence-based insights to guide equity initiatives
Leverage current insights to shape staffing strategies, budget forecasts, and long-term growth plans.
- Model salary costs for new hires or expanding teams
- Anticipate compensation shifts to align with firm growth
- Integrate benefits data into financial and HR planning
The AIA Compensation Benefits & Benchmark Tool is an exclusive add-on to the report that lets you explore compensation data interactively. Paired with the full report, the benchmarking tool gives firm leaders and HR professionals the flexibility to analyze the data that matters most.
- Compare salaries and benefits by region, firm size, and role
- Download data tables for custom analysis and reporting
- See exactly how your firm stacks up in today’s market
Only available as a bundle with the full AIA Compensation & Benefits Report 2025.
Which report is right for you?
The full AIA Compensation & Benefits Report 2025—190+ pages of salary and benefits data from 817 firms in 34 states, 45 metro areas, and 19 cities.
The full report + Excel tables—detailed comparison tables for custom analysis, compatible with your firm’s salary software.
The full report + NEW! AIA Compensation & Benefits Benchmark Tool—extra functionality to drill down by firm size, region, and role—and download custom tables.
The top metro areas report—covers Atlanta, Boston, Chicago, Dallas, Denver, Kansas City, Los Angeles, New York City, Philadelphia, San Francisco, Seattle, and Washington, D.C.
Regional reports—available for New England, Middle Atlantic, East North Central, West North Central, South Atlantic, East South Central, West South Central, Mountain, and Pacific.
Download a free preview!
Fill out the form to receive an executive summary of the report in your inbox.
Updated with 2025 data! Instantly view salary ranges for 20 key architecture positions in your area—powered by AIA Compensation & Benefits Report 2025 data.
Where does a starting salary go the furthest? See how new grad pay stacks up against living costs in major U.S. cities—using insights from the AIA Compensation & Benefits Report.
97% of firms report that they still work within traditional design phases.